
Purpose
This article explains how the current SEMS product surfaces live values, historical values and event state from a user perspective.
Three different timing layers
The current product separates several timing concepts:
- Live device polling
- Historical archiving / aggregation
- Browser refresh and chart updates
Do not treat them as the same interval.
Verified live polling behavior
From the current EMS service defaults:
- fast device polling baseline is
1.0 s - slow/background polling baseline is
60.0 s - alarm polling baseline is
2.0 s
Device profiles and diagnostic capture can override these values, so they are best treated as current product defaults rather than a guarantee for every deployment.
Historical data behavior
The current product contains dedicated history and telemetry-archive paths for:
- site energy history
- device history
- event history
- archived KPI/context data
The public-facing takeaway is:
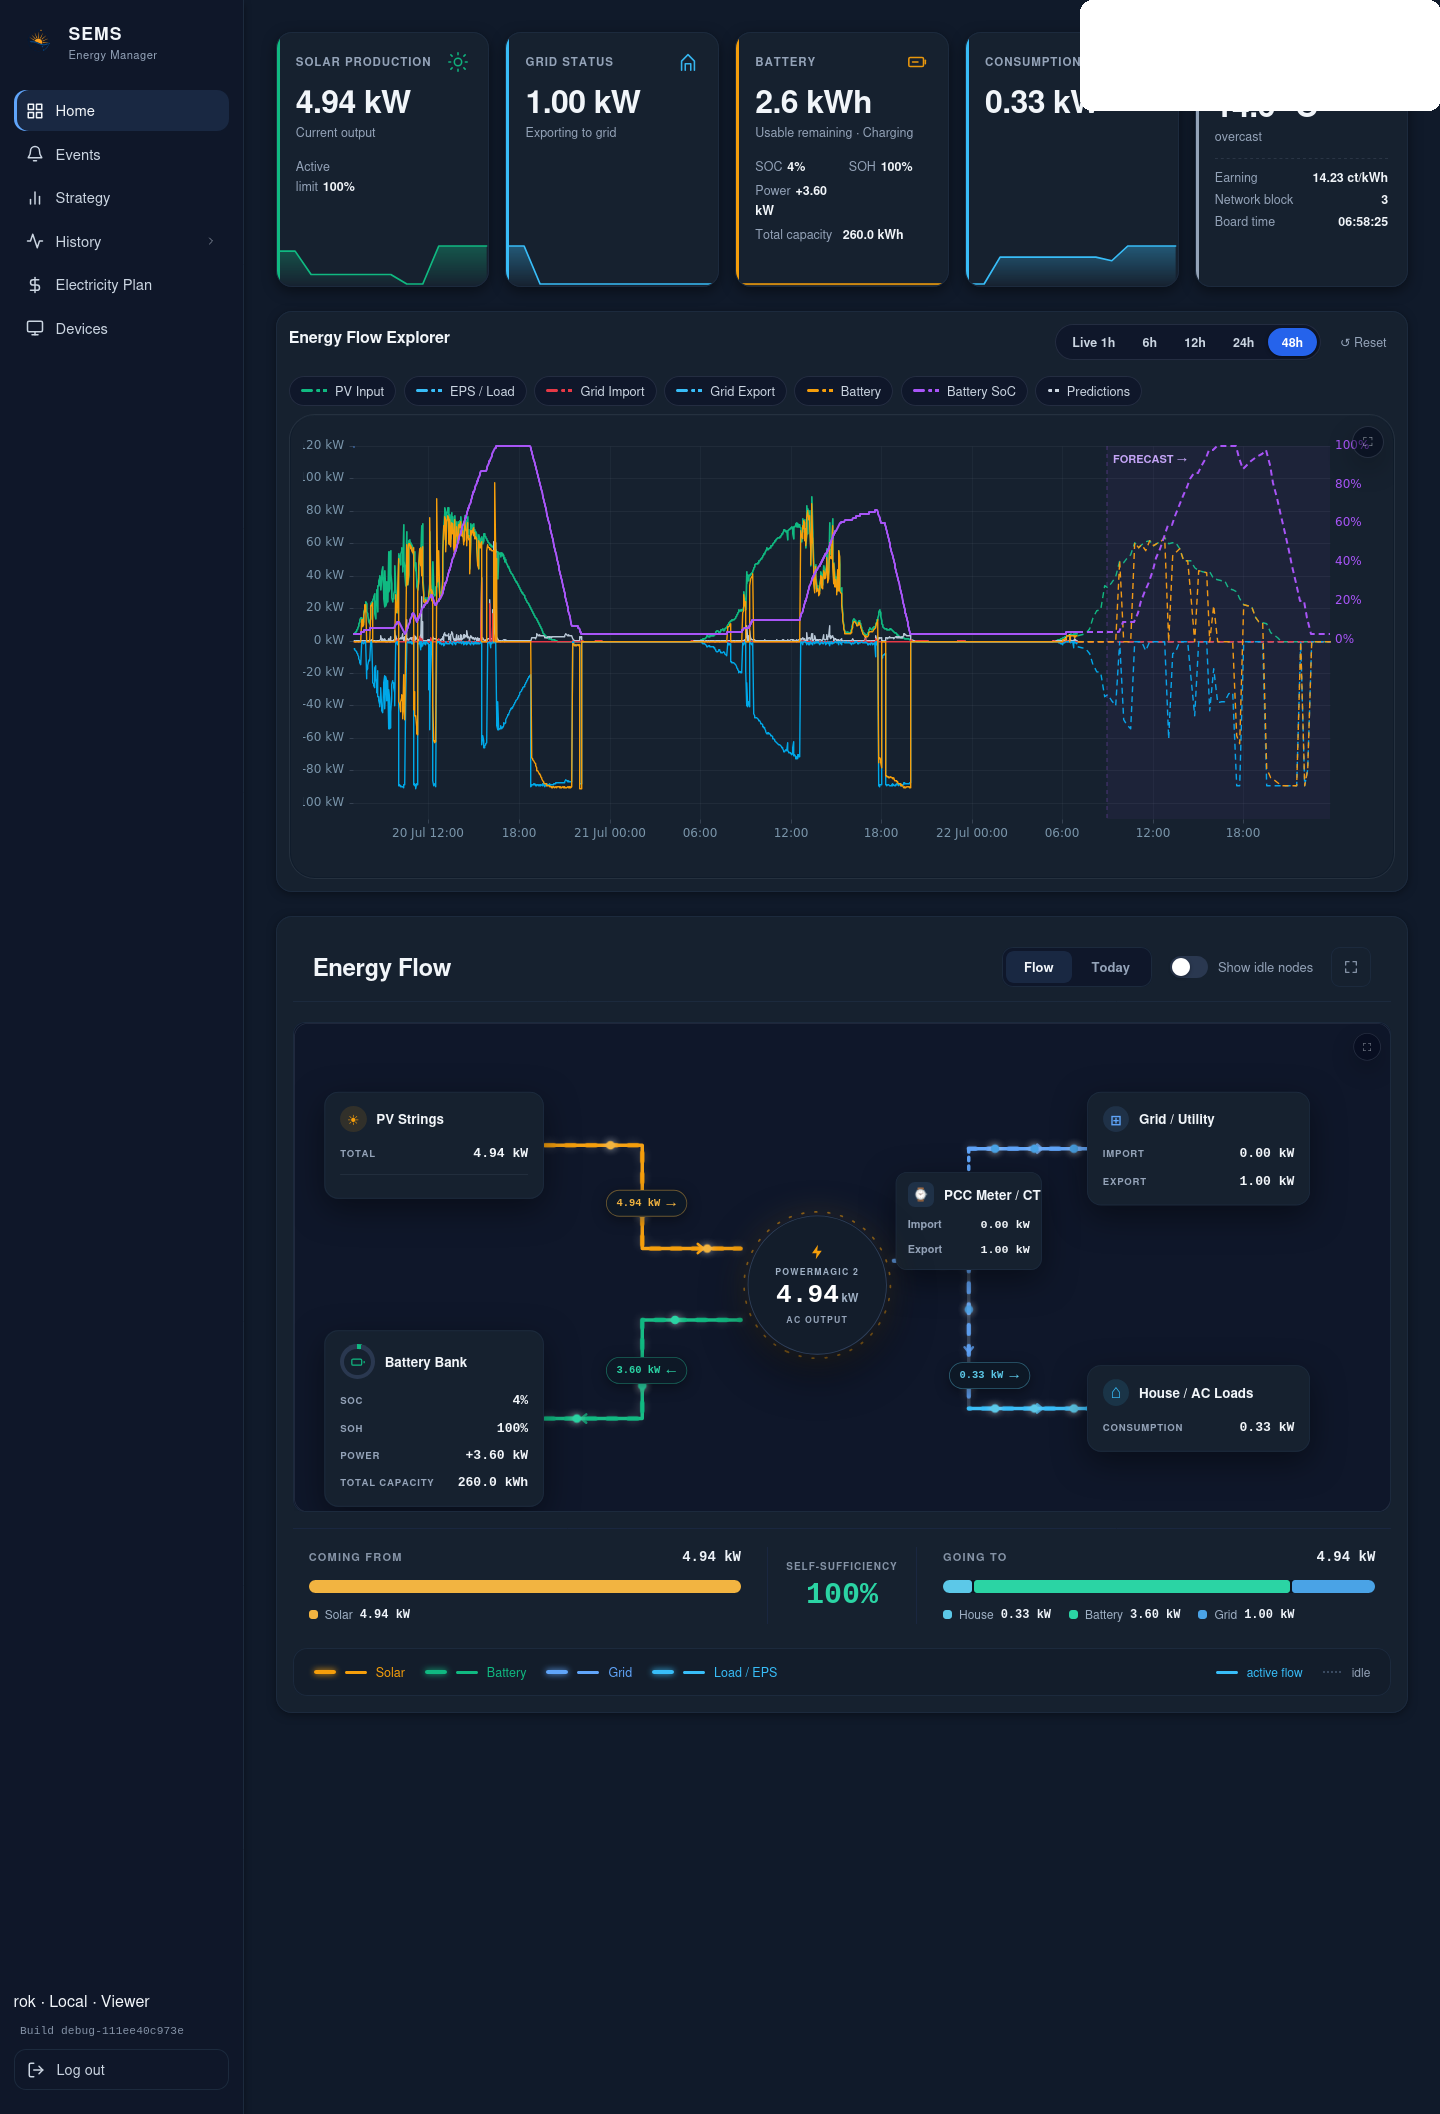
- current values are live snapshots;
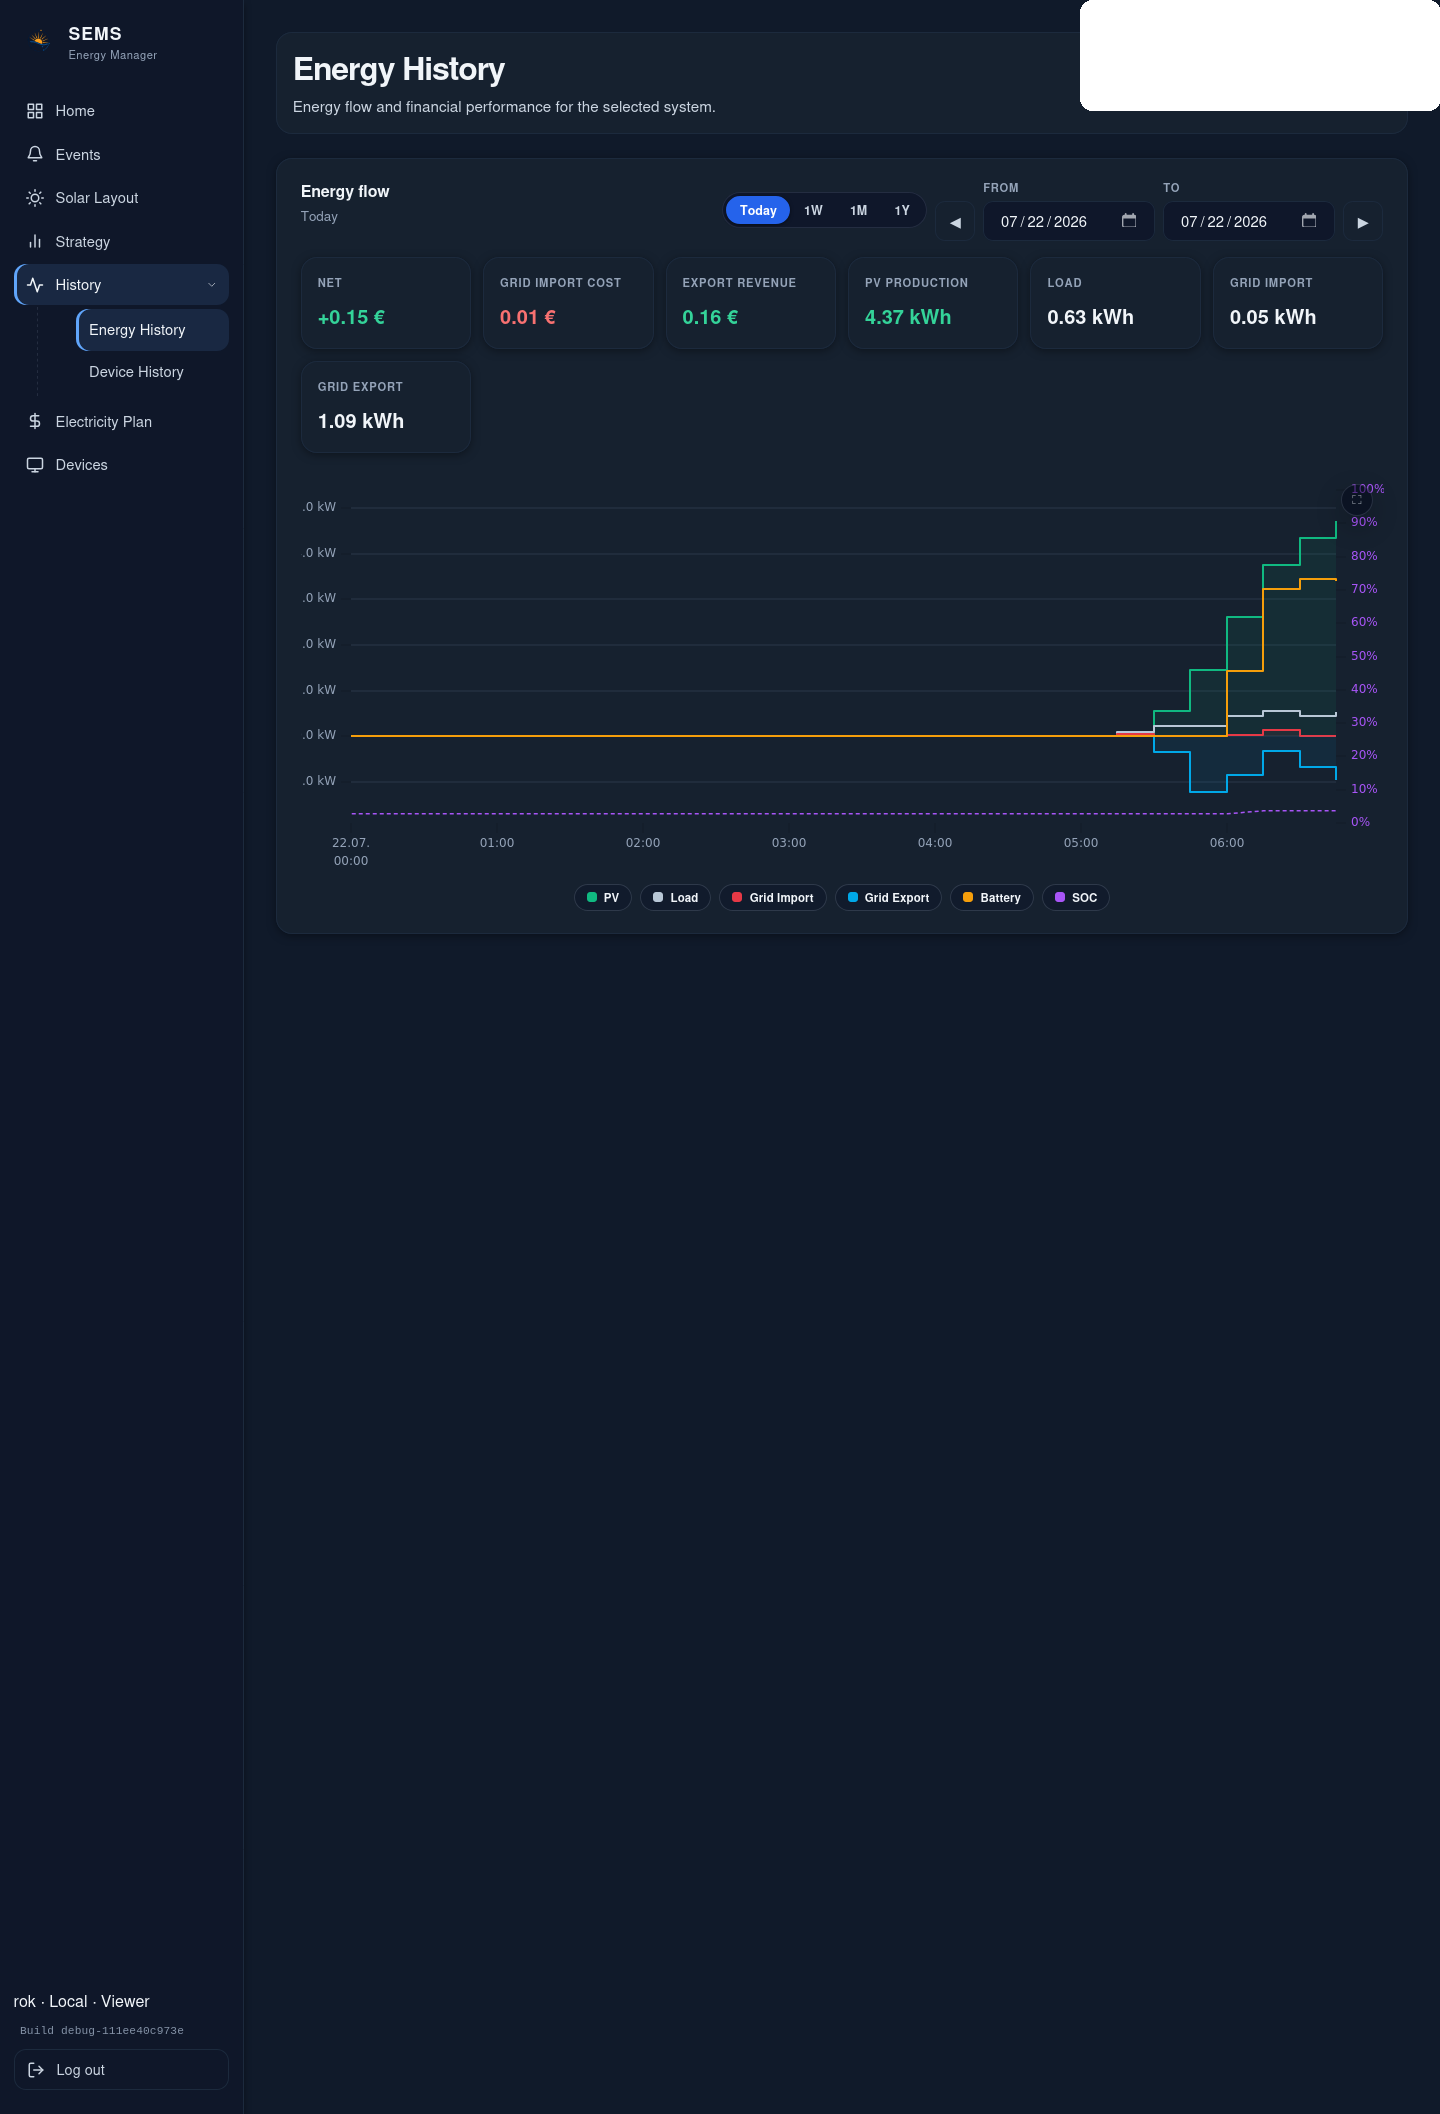
- historical pages use archived data and may show gaps when samples were unavailable;
- the displayed aggregation depends on the selected history range.
Dashboard and history views
The current UI exposes:
- live site dashboard cards
- energy-flow views
- site energy history
- device history
- event summary and event timeline
Event and alarm visibility
The current event page distinguishes:
- active vs cleared events
- severity
- acknowledged vs unreviewed state
- event history filters
Viewer-role responses are intentionally sanitized compared with higher-privilege event detail.
What operators should remember
- a fast-updating live value is not the same thing as archived history;
- missing historical points should be treated as gaps, not silently guessed values;
- alarm/event state must be reviewed separately from trend charts.
Was this helpful?
Did this article answer your question?
Feedback saved on this device. If you still need help, contact CyberSun support.