
Purpose
This article explains the major monitoring elements visible in the current SEMS dashboard.
Current dashboard elements observed in the inspected UI
- Solar Production
- Grid Status
- Battery
- Consumption
- Conditions
- Energy Flow Explorer
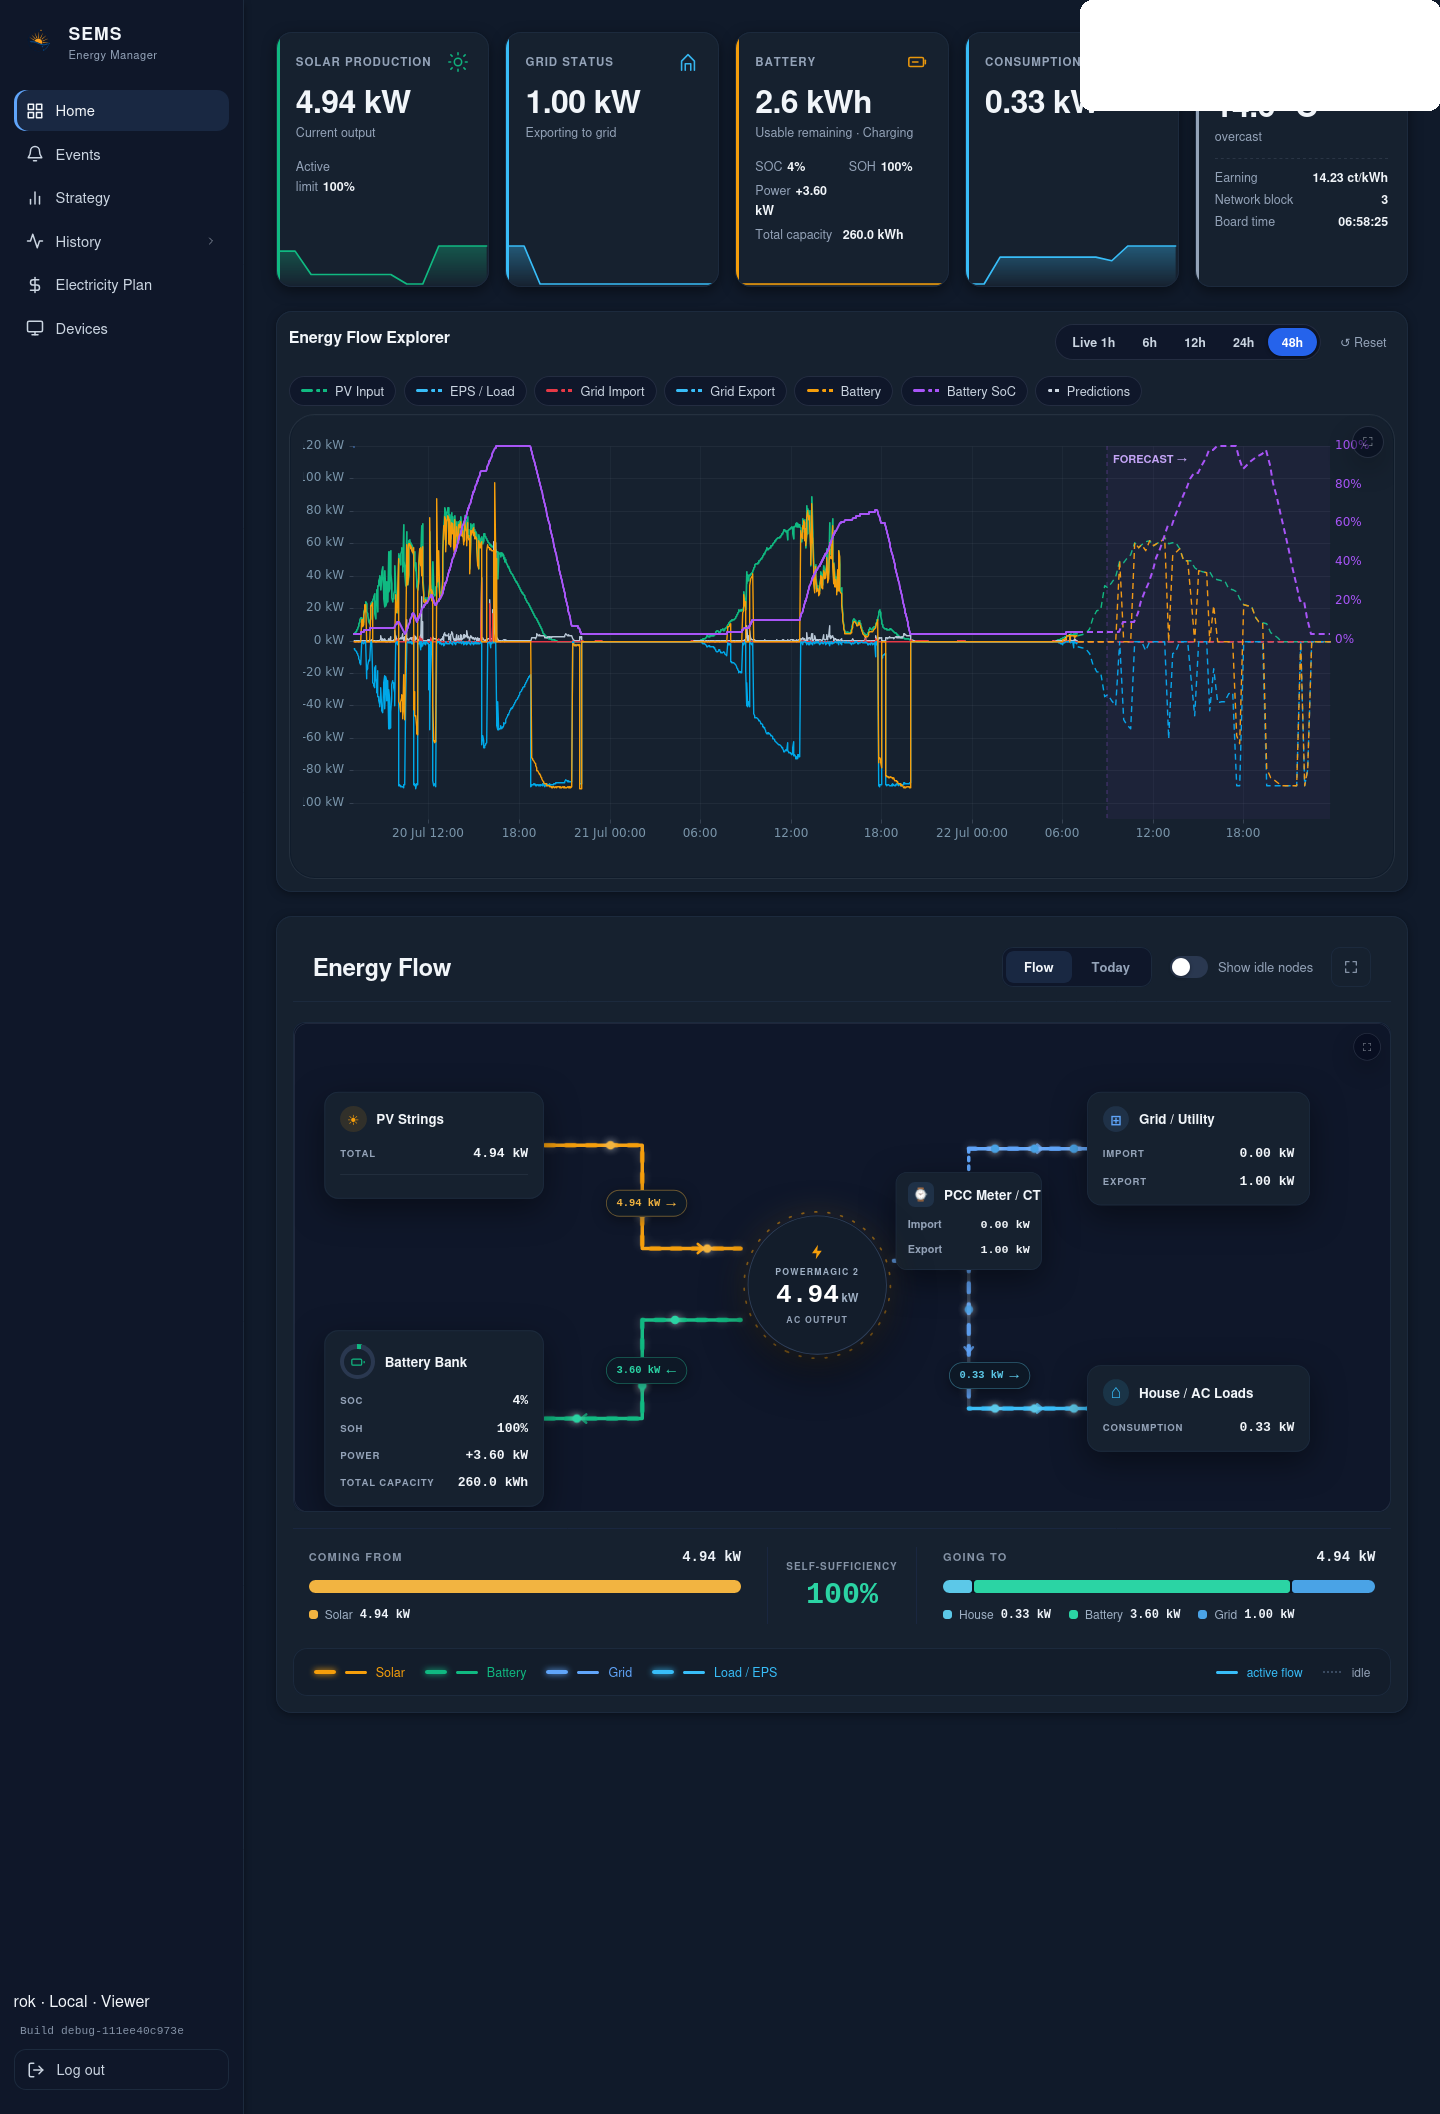
The current history/dashboard views also expose energy-flow ranges such as Live 1h, 6h, 12h, 24h and 48h.
How to read the dashboard
Solar production
Use this to confirm that PV production is present and directionally plausible.
Grid status
Use this to confirm whether the site is importing from or exporting to the grid.
Battery
Use this to confirm SOC and charge/discharge behavior.
Consumption
Use this to confirm site load and whether it behaves plausibly relative to PV and grid exchange.
Energy Flow Explorer
The current legend includes:
- PV input
- load / consumption
- grid import
- grid export
- battery power
- battery SOC
- predictions where available
Sign-convention rule
Always validate dashboard direction against a real site condition during commissioning. If one upstream sign is wrong, the dashboard can still look “busy” while being physically incorrect.
Was this helpful?
Did this article answer your question?
Feedback saved on this device. If you still need help, contact CyberSun support.